Agent Economics Lab
Your agent says it worked. Prove it.
Agent Economics Lab turns model and agent traces, independently checked outcomes, full cost, a named counterfactual, and policy into a decision someone else can reproduce. It carries evaluation into the production feedback loop for predictive models, generative components, and tool-using agents.
uvx --from git+https://github.com/Vyoma/agent-economics-lab@v0.10.2 agent-economics demo
Release notes · checksums · run it on your evidence · open the evidence-bound decision record · inspect the public-data findings · follow the production feedback contract
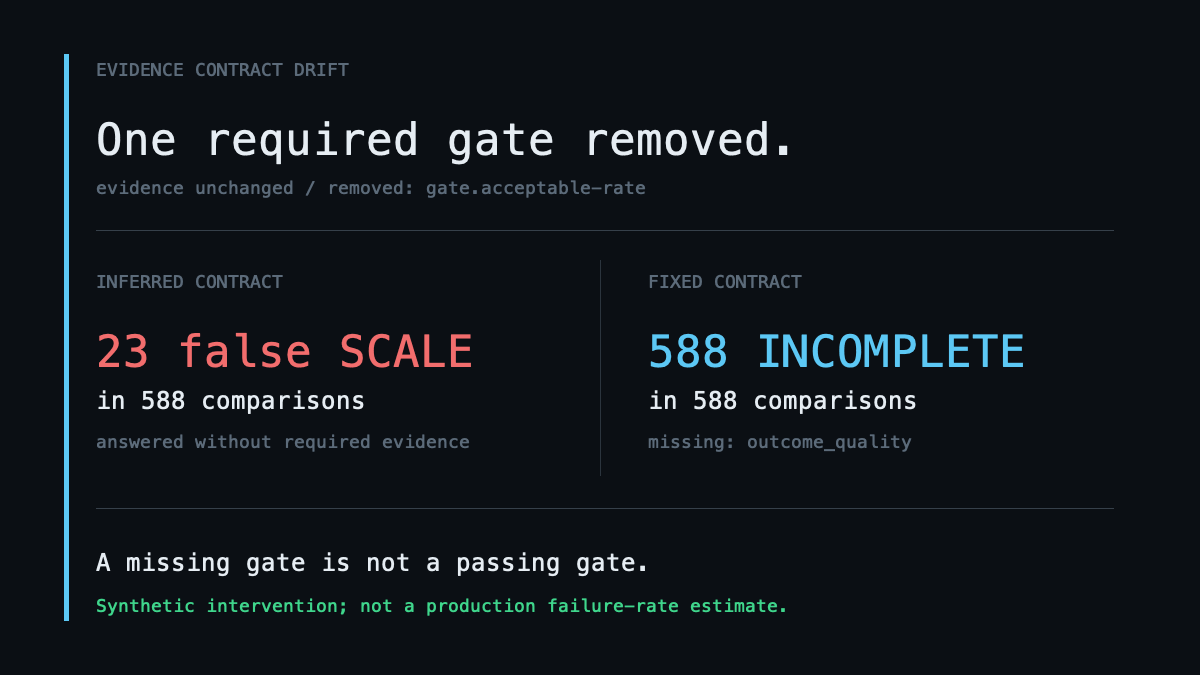
Static key frame generated from live decisions and recomputed in the test suite. Open the evidence-bound decision record. Synthetic intervention; not a production failure-rate estimate.
One result worth inspecting
How much can your LLM judge be wrong before your unit economics lie to you?
Every number below is reproducible with one command; the source is on GitHub.
You have an agent doing real work, and someone has to decide whether to give it more of the queue, keep a person alongside it, or turn it off. That decision needs a number, and the usual one is cost per successful task: everything you spent, divided by how many tasks came out usable.
Which requires deciding what counts as usable. At volume that means an LLM judge, which raises the question this piece is about: how accurate does the judge have to be before the number you compute is safe to act on?
The common answer is that around 80 to 85% agreement with human labellers is good enough. That figure traces to Zheng et al., Judging LLM-as-a-Judge with MT-Bench and Chatbot Arena, NeurIPS 2023 (arXiv:2306.05685), which found strong judges achieving “over 80% agreement, the same level of agreement between humans.” Read it again: that is a claim about parity with human consistency, not a safety threshold for a budget decision. It has been repurposed into one.
Which would be a minor sin if agreement were the right quantity. It isn’t.
Ten tasks, on paper
Ten tasks, $10 each, so $100 spent. Seven genuinely produced something usable.
True cost per success: $100 / 7 = $14.29.
Now let a judge label them, and let it make one mistake. It calls one of your seven real successes a failure. One error in ten.
Measured cost per success: $100 / 6 = $16.67.
A 10% labelling error produced a 16.7% error in the number. It grew on the way through, and the reason is structural: your $100 is already spent. Tokens burned, cleanup done, refund issued. Total cost does not depend on the labels. The judge can only move the denominator, and the denominator is the smaller number: seven, not ten.
So label error doesn’t add to your metric. It divides into it. Exactly:
relative error in cost-per-success = e / (r − e)
with e the label error rate and r the true success rate. Here 0.10 / (0.70 − 0.10) =
16.67%, matching the hand calculation.
A note on a shortcut you’ll be tempted by, because I published it and had to correct it:
“error divided by success rate,” e/r, gives 14.3% here. It’s the first-order
approximation, and it understates the damage by 2× in the regime that matters most. Use
the exact form.
Across success rates, for a fixed 5% label error:
| true success rate | 5% label error becomes |
|---|---|
| 90% | 5.9% |
| 50% | 11.1% |
| 20% | 33.3% |
| 10% | 100.0% |
Amplification tends to 1/r. On a workload that succeeds 10% of the time, 5% label error
is a 100% error in your unit economics, and low-yield workloads are the ones where
someone is already arguing about the budget.
Two mistakes can be better than one
Same ten tasks. The judge still falsely rejects one real success, but now it also falsely accepts one real failure. Two mistakes instead of one. Agreement has fallen from 90% to 80%.
Measured cost per success: $100 / 7 = $14.29. Exactly right.
The denominator counts how many tasks were called acceptable. A false accept adds one, a false reject removes one, and in equal numbers they cancel. What drives the distortion is not how often the judge is wrong but
D = false accepts − false rejects
the net bias. On 100 tasks with 70 real successes:
| false accepts | false rejects | agreement | error in cost per success |
|---|---|---|---|
| 15 | 15 | 70% | 0.00% |
| 15 | 0 | 85% | 17.65% |
| 0 | 15 | 85% | 27.27% |
| 7 | 0 | 93% | 9.09% |
A judge disagreeing 30% of the time can leave the metric untouched. A judge at 93% agreement can break it. No threshold on agreement can fix this, because agreement throws away the direction of the errors.
So when someone quotes their judge’s agreement rate, the useful question is: which way does it miss? Without that, the figure doesn’t constrain anything.
The threshold
Your gate says ship if cost per success is below some limit, and you’re currently below it
with room to spare. Call that room s, the slack, as a fraction of the metric: limit
$2.00, currently $1.82, slack ≈ 10%. The largest net bias that room absorbs is
e* = r · s / (1 + s)
At r = 0.70, s = 0.10: 6.36%. If you know nothing about how your judge’s errors
compose, you need agreement around 93.6% to guarantee that, but that’s the worst case,
not a requirement. The balanced judge above cleared the same gate at 70%.
Two caveats before you use it. e* is a bound on net bias, so compare it against
|FP − FN|/n, not against a disagreement rate. And both r and s are defined on
ground truth you don’t have: plugging in judge-observed values fails unsafely, because
false accepts inflate both, making the requirement look about 1.8× looser than it is.
Measuring your judge’s net bias
This is the part that makes the rest usable, so here it is concretely.
Take a random sample of m tasks, get human labels, and count false accepts and false
rejects in the sample. Your estimate is b̂ = (fp − fn)/m. Because those are disjoint
outcomes,
SE(b̂) = sqrt( (d − b²) / m )
where d is the total disagreement rate. (Simulated against the closed form: 0.01349 vs
0.01369 at m = 800.) So the labels you need for a 95% interval half as wide as your
tolerance:
tolerance e* |
judge disagreement | target ± | human labels needed |
|---|---|---|---|
| 6.36% | 15% | 3.18% | 570 |
| 6.36% | 30% | 3.18% | 1,139 |
| 4.55% | 15% | 2.27% | 1,116 |
| 1.82% | 15% | 0.91% | 6,973 |
Three things fall out of that table.
A few hundred labels is usually enough, which is a smaller ask than most teams assume and is the reason to do this rather than argue about it.
Tight gates are expensive to certify. A gate with 1.8% tolerance, meaning you sit close to your limit, needs about 7,000 human labels. If you can’t afford that, you cannot honestly claim the gate is safe, and the right move is to widen the slack or change the metric rather than to proceed.
Sample stratified by whatever your judge finds hard. Judge error correlates with task difficulty, which correlates with genuine failure, so a uniform sample understates bias on the hard stratum. Stratify and reweight.
Correcting it, rather than tolerating it
Once you have those two numbers, don’t just check them against a threshold. Invert them.
Write se for sensitivity (fraction of true successes the judge accepts) and sp for
specificity (fraction of true failures it rejects). The judged positive rate q relates
to the true rate p by q = p·se + (1−p)(1−sp), so
p = (q + sp − 1) / (se + sp − 1)
Use p·n as your denominator instead of the raw judged count. The inversion is exact, so
in expectation the bias goes to zero rather than merely shrinking:
| true rate | sens | spec | judged rate | uncorrected error | corrected |
|---|---|---|---|---|---|
| 70% | 0.90 | 0.80 | 0.690 | 1.4% | 0.0% |
| 20% | 0.85 | 0.95 | 0.210 | 4.8% | 0.0% |
| 50% | 0.95 | 0.70 | 0.625 | 20.0% | 0.0% |
| 10% | 0.80 | 0.90 | 0.170 | 41.2% | 0.0% |
This is standard prevalence correction rather than a new idea; epidemiologists have used it since the 1970s on exactly this shape of problem. It needs nothing you did not already collect to measure net bias.
The zeros are the point and also the catch: they are exact only if se and sp are
exact. Three failure modes follow. The denominator se + sp − 1 shrinks toward zero as
the judge approaches a coin flip, and the correction amplifies your estimation error as it
does. It assumes se and sp are stable across the workload, which fails when the
traffic mix shifts. And it inherits the uncertainty of your sample, so propagate the
interval rather than quoting the point estimate. The real gain is not that error vanishes;
it is that the error becomes a function of your sample size, which you control, instead of
a function of the success rate, which you do not.
Or change the metric
There’s a cheaper route if the sampling is out of reach. The amplification came from the
label sitting in a denominator, so use a metric where it doesn’t. Net value per
attempt, N = (Σ value − Σ cost) / n, puts the label in a sum, and n is the whole
workload, a number the judge can’t touch. Error propagates linearly.
Two honest limits, because the first version of this write-up called it free and that was overselling.
It needs a defensible dollar value per successful task, which is usually a negotiation with whoever owns the P&L rather than an afternoon’s work. When I applied this to a public coding benchmark I could not obtain one; I credited value at zero rather than invent a figure, and the result was a verdict that was negative for every possible set of labels.
And the advantage inverts near break-even. The flip threshold for an N ≥ 0 gate is
N / v_max:
| cost per task | net value | threshold | vs the ratio gate’s 6.36% |
|---|---|---|---|
| $6.00 | 1.00 | 10.0% | looser |
| $6.90 | 0.10 | 1.0% | 6× tighter |
| $6.95 | 0.05 | 0.5% | 13× tighter |
Comfortably profitable: switch and win. Barely above zero: switching makes it worse.
The tool this came out of
The formula above is separable: two numbers off your dashboard and you never need the rest. But it came out of building something, and that context explains the next section.
The system takes agent traces, works out what one usable outcome actually cost, checks it
against limits written down in advance, and returns SCALE, ASSIST, STOP, or
INCOMPLETE.
INCOMPLETE is the design point. If a required check did not run, it refuses to answer
rather than answering without it. Disable one required gate, leave the evidence untouched,
and an engine that infers its requirements from whichever gates happen to be enabled
shrinks its own contract and answers anyway: 23 false SCALEs across 588 comparisons,
against 588 INCOMPLETEs from a fixed contract. That is a deterministic fixture, and the
23 counts only cases where the disabled gate was the sole failing one.
The static figure at the top of this page is generated from live decisions by
make figure, and its displayed counts are recomputed in the test suite. It is
a synthetic intervention, not an estimate of how often production systems fail
this way. Motion is intentionally not part of the default reading path.
make demo
Zero dependencies beyond the standard library. Apache-2.0. Over 850 tests on Python 3.10 through 3.13.
The terminal result can also be issued as an Agent Decision Record. Before producing the review card, the renderer replays the decision, checks the evidence and policy digests, verifies the cited artifact bytes, and refuses to write HTML when any binding fails. The record establishes internal consistency against supplied evidence; it does not turn the supplied labels, economics, or reviewer assertions into ground truth.
Measurements that cannot fail
One more thing, because it cost me more than the algebra did.
I built a system around all this and then tried to measure whether the design was good. Two of the numbers I produced looked like evidence and weren’t, in the same way, and it’s a shape worth recognising in your own dashboards.
A fault-injection harness reported that the design caught 510 of 510 injected faults. It could not have reported less. The architecture pins six required checks, each supplied by exactly one gate; remove a gate and a requirement has no provider, so refusing is the only reachable state. Under the fault that actually happens in production, replacing a check with one that keeps its name and stops enforcing, it scored 487/510, and so did the naive alternative it was supposed to beat.
The same system reports p95 task cost. On the bundled demo it prints a p95 of $14.25 and a
maximum of $14.25, because ceil(0.95n) is n for any workload under twenty tasks. One
number wearing two names, failing a tail-risk gate.
Neither was caught by over 850 tests. Tests check that code does what you specified; they say nothing about whether what you specified can produce a bad number. The check that would have caught both takes seconds:
Write down the mechanism in one sentence, then ask what input would make the number worse. If you can’t name one, you don’t have a measurement.
What isn’t known here
The threshold is conditional: given a judge with net bias e, the decision behaves as
derived. What net bias real judges carry on real workloads, against real ground truth, is
not something I’ve measured, which is why the procedure above matters more than the
formula does.
And when the demo’s own cost assumptions are varied within plausible ranges, 55 of its 98 scenarios (56.1%) change verdict. A “ship it” from one of those describes the assumptions, not the agent.
Three further limits worth stating plainly:
- Agreement is not accuracy against ground truth. The derivation is about error against truth; published agreement figures are usually against another labeller. This project’s own judge evaluation states its labels are not validated ground truth.
- The agreement column assumes the worst case, all error running one direction.
- How often 85% suffices is grid-dependent. 1 of 15 cells with slack capped at 25%, 4 of 20 at 50%, 8 of 25 at 100%. The command reports the count per cap rather than one headline, for the reason in the previous section.
Everything else the project knows it gets wrong is in limitations and non-claims.
The rest of the documentation
| Specification | the exact contract, conformance-tested clause by clause |
| Product requirements | who it is for, and the refusals that define it |
| Roadmap | maturity per layer, stage gates to production |
| The instrument’s scorecard | how good the auditor is, blind spots included |
| Derivation | the four propositions and their verification |
| Limitations | every known non-claim |
| Corrections | every time this project was wrong, and how it found out |
| Methodology | how a decision is computed |
| Landscape | prior art and the narrow delta |
| Modularity | explicit composition and source adapters |
| Frontier | the cheapest configuration that still clears policy |
Adapters: Claude Code · session trees · OpenTelemetry GenAI · Kimi labelling
Apache-2.0. Derivation, checks, and the retractions:
git clone --branch v0.10.2 --depth 1 https://github.com/Vyoma/agent-economics-lab
cd agent-economics-lab

python3 -m agent_economics.label_error -r 0.62 -s 0.08
#   tolerable net bias      4.59%
#   sufficient agreement   95.41%
Found a claim here that does not survive your data? Open an issue.